When a Pie Chart Stole the Show: Packaging’s Secret Weapon Returns
It snuck back in. Quietly. Behind the loud colours and loud-er Copywriting™, the humble pie chart has crept onto FMCG packaging again. You’ve seen it. A friendly, little segmented blob whispering, "See? We’re 95 percent natural. We swear." But here’s the curveball. It's not just for health claims anymore. Something’s changed.
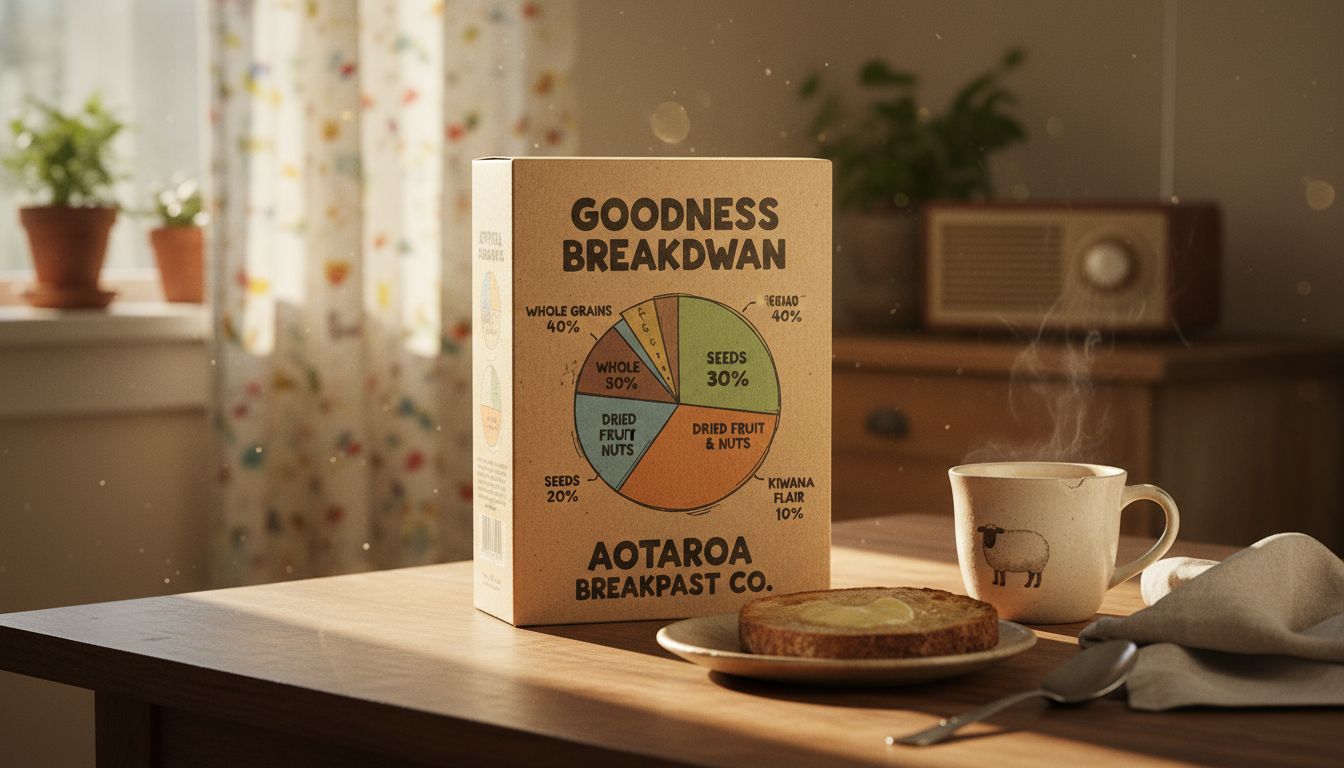
Call it the Quantified Brand Movement. Labels that used to say vague things like "with love" or "crafted in small batches" now come with charts: graphs of carbon savings, percentages of social impact, or one brilliant example I saw last week, the breakdown of how much of the price actually goes to the maker. It wasn’t just transparent. It was oddly thrilling. Why? Because we forgot packaging could behave like journalism.
Brands like to act chatty, human, cheeky. But now some are getting statistical and still managing to be charming. It’s like seeing your funniest friend actually do well in Year 13 Stats. It hits. And it sticks. Short, numerical bursts on packaging create a new feels-like-the-truth effect. Unlike a waffly tagline or those haunted eyes on a fake farmer’s portrait, a clean bar chart looks like it has nothing to hide. The numbers are tidy. The intention, even tidier.
This shift isn’t maths for maths sake. It’s design nudging psychology. Our brains love proportion. Circles, thirds, slices. The visual primacy of data is kicking back in, made snack-sized for supermarket speed-readers. It’s also an oddly Kiwi move. Straight up. No fluff. No gloss. Just tell me, graphically, what you actually DO. And if you can make a pie chart charming? You just won the shelf.